[데이터마이닝]ThreeDimPlot Matplolib 3차원
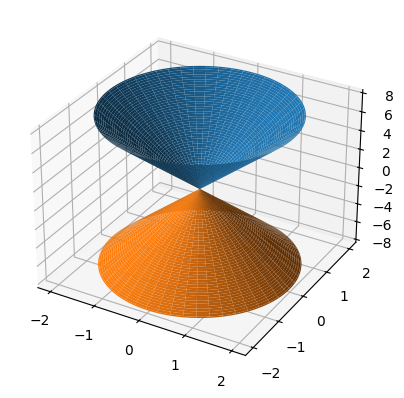
시각적으로, 두 개의 원뿔이 대칭적으로 위치한 3D 그래프import numpy as npimport pandas as pdimport matplotlib.pyplot as pltr = np.linspace(0, 2, 100)theta = np.linspace(0, 2 * np.pi, 100)R, Theta = np.meshgrid(r, theta)x = R * np.cos(Theta)y = R * np.sin(Theta)Z1 = 4 * RZ2 = -4 * R%matplotlib inlinefig = plt.figure()ax = plt.axes(projection='3d')ax.plot_surface(x, y, Z1 )ax.plot_surface(x, y, Z2)